Now it is time to analyze at what jackpot is the expected value of a ticket maximal. To do so, first estimate the number of tickets sold for a given jackpot size by collecting data for lottery ticket sales across the United States for Powerball. Graphing the number of tickets sold as a function of the jackpot shows that the curve is approximately quadratic. Running linear regression will find the best fit quadratic formula. If T(j) is defined to be a function of the jackpot that outputs the number of tickets sold, the finding is:
T(j) ≈ 278.36j2 – 5364.95j + 10582740.74
with j measured in terms of millions of dollars.
Given this model, EIR[XT(j)]-the expected value of a ticket for a given jackpot-can be evaluated, because the expected value of a ticket can be computed for the random independent generation scheme, where k = T(j) is the number of tickets sold and N is the size of the ticket space (the size of the ticket space N is 292,201,338 for Powerball), as

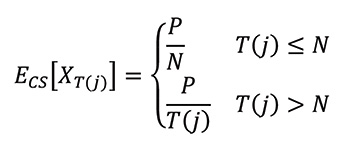
Similarly, for the (ideal) central server approach, ECS[XT(j)] can be evaluated as:

The cost of each lottery ticket is $2, so we are interested in situations when the expected value of a ticket is greater than $2. For the standard Quick Pick scheme, one can expect to see returns when the jackpot is between $775 million and $1.67 billion. A ticket provides its maximal return when the jackpot is around $1.02 billion, but as the jackpot grows larger and larger, the expected number of tickets to be sold grows quadratically, and hence, the number of collisions overwhelms the returns of the jackpot. It becomes more and more likely that the prize will have to be shared among more people.
